This post has my opinionated ideas about this topic. We don’t need to agree, but it’s important to use it as a starting point to discuss.
DORA provides a clear approach to understanding the effectiveness of a software delivery process. One of the keys of DORA is that it doesn’t attempt to measure productivity, instead, they are focused on measuring velocity and stability.
There are four key metrics divided into two groups that are used to measure the performance of teams. These metrics create visibility and data that can be used for improvements and decision-making.

Deployment Frequency
- Frequency of successful releases deployed to production. The frequencies are daily, weekly, monthly or yearly.
It is important to note that frequency is not volume. What I mean by that is, for example, if your team had 30 deployments in the last month, it doesn’t necessarily mean that your frequency was daily. All these deployments could have happened in the last week of the month.
Lead Time for Changes
- The median amount of time between a commit made and its artifact deployed into production.
Mean Time to Recovery (MTTR)
- The median amount of time between the start and remediation of an incident.
Change Failure Rate
- The division between the number of failed deployments by the total number of deployments.
What is a successful or failed deployment?
That’s the tricky part. I can’t define precisely what is a successful or failed deployment for all applications and use cases, but we can try to cover most of them.
With all these metrics, the thing that we are most concerned with is the experience that the user is having. In other words, for a deployment to be considered successful it has to reach the user. To be considered a failure, it has to reach production and impact the users. What this means is:
- If a deployment failed to build and didn’t reach production, we don’t care about it.
- If your CD pipeline waits for the new version to be ready/health, but it reaches a timeout and the pipeline does a rollback to the latest health version before the traffic was changed to the new version (the users didn’t experience a failure), we don’t care about it.
What are the implications of this “definition”?
The implication is how we classify deployments as failures. With this classification, we can understand how to extract the stability metrics (MTTR and Change Failure Rate).
The main implication is: A deployment is classified as a failed deployment if any incident happened during the time it was active.
Why is that? Because an incident can be one of the best ways to know if we are having any problems in production.
This implication is reflected in the earlier definition of Mean Time to Recovery (MTTR).
The median amount of time between the start and remediation of an incident.
I think you could have asked: Why should I use the time between the start and remediation of an incident, rather than the time between the deployment and remediation of an incident?
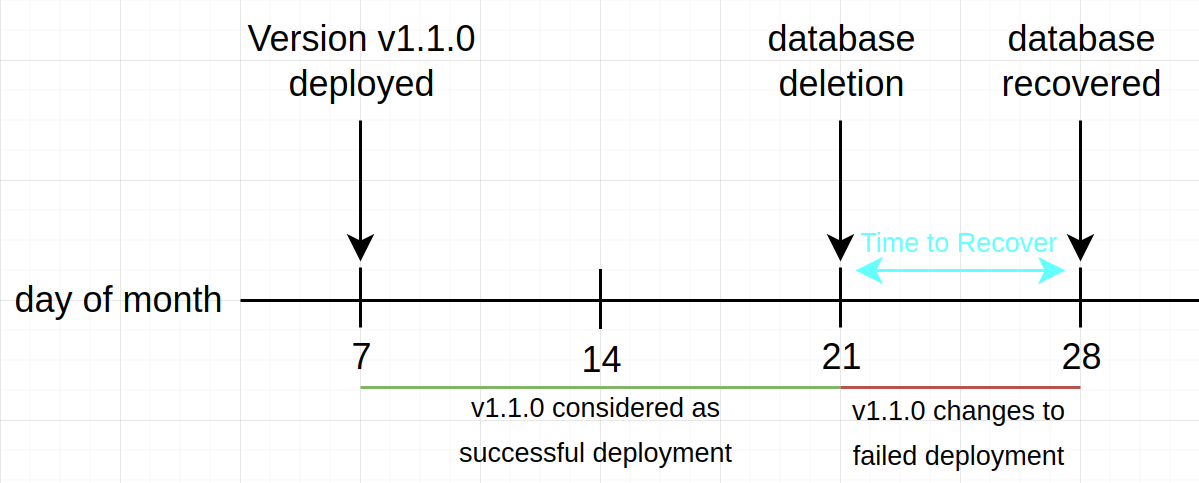
That’s because the root cause of a failure isn’t always the deployment. Let’s explain it with an example: your team has deployed a new version of an application and, two weeks later, someone accidentally deletes the database in production.
In this case, an incident is triggered because the application isn’t healthy anymore. One week later, the incident is solved because the database was recovered.
The amount of time that the user was experiencing a failure is one week, not three weeks. The image below represents this use case:

Antipatterns
With these metrics in place, there are some common misuses of them that we can classify as antipatterns.
Comparison of teams
We are not measuring performance and should not use these metrics to compare different teams.
Each team has a different context, which makes their performance unique to their constraints.
Metrics as goals
We should not make metrics become the goal. Metrics should be a means to an end.
High performing organization focus on improving how they deliver value. The goals should focus on business outcomes, and not the metrics.
Conclusion
I found the video Measuring DevOps: The Four Keys Project one of the best easy-to-consume references to this topic. If you want to deep more into the topic, I would recommend:
- The Google Cloud blog post The 2019 Accelerate State of DevOps: Elite performance, productivity, and scaling.
- The book Accelerate: The Science of Lean Software and DevOps.
If you have any questions, suggestions or want to discuss the topic even further, reach me out on Twitter!